Hello (3D) World
I recently needed a custom way to show geographic location data that would pop a bit for a CV site. The end result being as seen in the GIF below.
This article will walk you through the steps from inspiration, data preparation and implementation using WebGL through THREE.js.
The example code will be a stripped down version of the globe I needed for my specific use case, but will render the same geometries, but not go into the panning and animations — allowing for a more coherent and sequential code. I will still hint at which attributes that can be animated for performance reasons. Code available on GitHub (see medium_article_version/index.html).

Step 1: Inspiration
I wanted to have something that would have a similar feel to it as a wire-frame model, while being clearly recognizable as geographical locations.
A few years ago, there was a geographical visualization of world population going around the internet, that was used as a cover for some sort of geographic society (I couldn’t find it before finishing the actual 3D implementation, but then I recalled the word population lines before writing this article making it just a quick google search away).
Would that hold up to a 3D version as well (using a standard digital elevation model, not population data) or would it be too busy visually speaking? Would it make sense to stick with latitude lines, longitude, both? No other way than to test and see.
Step 2: Feasibility and Data Control
We need to get our hands on elevation data. Searching for DEMs (digital elevation models) has a few ones which are freely available for use, but they make it very difficult to download in batch, the GLOBE project luckily made their tiles available to download zipped, to a reasonable combined file size of ~300MB.
The data is in binary format, so just to help anyone wanting to use R to read in the data, the following format and table 3 from the GLOBE data manual will help.

# Example code for reading in the A10G
connection = file("./all10/a10g", "rb")
N_COL = 10800
N_ROW = 4800# Read in the binary data, NOTE data has little endian format
data = readBin(connection, integer(), n=N_COL*N_ROW, size=2, endian = "little")
close(conn)# Set dimensions of data matrix
dim(data) = c(N_COL, N_ROW)
After that, for feasibility, I worked on getting a static version done, subsampling elevation data along the latitude at a fixed distance, and applying a kernel to it before plotting the results.

The data looks okay, so it was time to switch to a 3D version
(NOTE: I did not end up using elevation data with a Kernel applied to it after the first attempt when it was clear that using the raw data would work)
Step 3: 3D Globe
THREE.js provides quite a lot of nice abstractions over WebGL, allowing us to stay within Javascript, and avoiding learning GLSL just a tiny bit longer. Still there are more than a few things we need:
i) a Scene
ii) a Camera
iii) Light(s) (we need to see something duh)
iv) Objects/geometries in the scene (we need to have something to see duh)
v) a Renderer
vi) Controls/animations
In the example code I will initialize variables that are then passed in to the different constructors directly in an init() function. Anything that will be required to hold a reference to for a render() loop will be declared as globals at the start of the script.
Note: This ‘code structure’ quickly gets unmaintainable, it has been hidden a slightly better way and split up into different objects in the actual project code also found in the repo. Here it follows the text introduction order, which is… good to get to know the APIs.
Globals
Some things will be required for the rendering loop.
// Globalsvar scene, renderer, camera, controls;
i) Scene
We are now inside the init() function. Where we get a reference to a div element declared in the HTML that will contain the webGL-canvas.
// Get frame referencevar frame = document.getElementById('globe-scene-container');// Init scenescene = new THREE.Scene();
ii) Camera
Trying to showcase the values chosen, and how they are ordered for the camera API, the snippet below creates a camera.
There are plenty of tutorials online that will cover this more in detail what the meaning of all these values are, but note the use of camera.up.set(0,0,1) which sets the up direction of the camera, giving us a coordinate system which is more in line with the 3D math I personally learned in school instead of the one used in game programming. Incidentally, it is also the one used in Wikipedia’s article on Spherical coordinate systems, making it easy to use any formulas without modification.
Most of these values are set when knowing how large the objects in the scene will be, so that most things can be kept in view.
var cameraConfigs = {
 FOV: 35,
 ASPECT: frame.clientWidth/frame.clientHeight,
 NEAR: 0.1,
 FAR: 200,
 INIT_POS: {
  x: 2,
  y: 0.6,
  z: 4
 }
};
camera = new THREE.PerspectiveCamera(
 cameraConfigs.FOV,
 cameraConfigs.ASPECT,
 cameraConfigs.NEAR,
 cameraConfigs.FAR
);
var pos = cameraConfigs.INIT_POS;
camera.position.set(pos.x, pos.y, pos.z);
// Setting up direction to make sure coordinate system used is correct
camera.up.set(0,0,1);
// Placement of globe will have center at [0,0,0]
camera.lookAt( 0,0,0 );
iii) Light(s)
Note: For the materials used in this example, none of them are affected by lights. But for almost any other scene there will be a need to add lights to show them. Hence, it is good to have something in the scene in case more objects are to be added.
We will only need one light. We don’t want to get any particular effects from specular lighting or anything like that — a constant light source without shadows will do — which translates to AmbientLight in THREE.js
Note that the colour of the light is passed in in HEX-format, or using THREE.js convenient Color constructor.
// Init light and add to scenevar light = new THREE.AmbientLight(0x04040c);scene.add(light);
iv) Objects/geometries
Objects will be added in two steps.
First we will just add a sphere object that will make up the globe and in the next few steps make sure that it is placed and rendered correctly. After that we will add other objects to the scene.
We just want a basic material with less than full opacity — to also allow things on the back of it to be partly in view — and a constant color (i.e. not affected by any lights).
var globeConfigs = {WIDTH_SEGS: 16,HEIGHT_SEGS: 16,GLOBE_OPACITY: 0.7,EARTH_RAD: 1,MULTIPLIER: 1E-5,COLOR: 0x04040c};var earthGeometry = new THREE.SphereGeometry( globeConfigs.EARTH_RAD, globeConfigs.WIDTH_SEGS, globeConfigs.HEIGHT_SEGS);var earthMaterial = new THREE.MeshPhongMaterial({ transparent: true, opacity: globeConfigs.GLOBE_OPACITY, color: globeConfigs.COLOR});var earthMesh = new THREE.Mesh(earthGeometry, earthMaterial);earthMesh.position.set(0, 0, 0);scene.add(earthMesh);
v) Renderer
A renderer is absolutely required to display anything from the scene. Most of the code below is very explicit in the naming and makes it relatively obvious what is happening. Note the use of the frame reference, which we kept from i) Scene above.
// Init rendererrenderer = new THREE.WebGLRenderer({antialiasing : true});renderer.setSize(frame.clientWidth, frame.clientHeight);renderer.domElement.style.position = 'relative';// Background set to blackrenderer.setClearColor (0x000000, 1);frame.appendChild(renderer.domElement);renderer.render(scene, camera);
After calling the init() function, we can now see something render to screen. This is quite a lot of code just to get something — ANYTHING — showing on screen, and if done from scratch may require quite a few iterations before things are displayed in the way you had in mind.

vi) Controls/animations
We also want to allow for some movement of the objects in the scene.
We could choose to animate the rotation ourself and try to calculate mouse interactions, but this is such a common task that there is a THREE.js extension called OrbitControls.
Note: Orbit controls allow the camera to orbit around a target. However, with nothing for the eye to reference, it will have the same visual effect as the globe rotating.
Making a small addition to the init() function:
// Init controls [inside init() function]controls = new THREE.OrbitControls( camera );controls.autoRotate = true;
It is also required to have the scene updating and re-rendering at regular frequency to see our controls in action, so we need a render() function which is called after the init() function. This simply updates the controls, re-renders and schedules a new call to the render function. Any additional ‘paint’ updates can go before the call to renderer.render() .
var render = function render(){ controls.update(); renderer.render(scene, camera); requestAnimationFrame(render);}init();render();
We will adjust the globe a little bit to see if the changes take effect. Setting the globeConfig.[WIDTH_SEGS|HEIGHT_SEGS] from 16 to 6 to make it less round and altering the colour of the sphere.
Time to change back the colour and shape of the sphere to what we had before and add some other things to our globe.
Note: We are lucky enough to have the globe “rotate” in the correct direction without any alterations, as will be seen once we add elevation.
iv) Objects/geometries (revisited)
First of all, we want to add the lines in for the elevation. To graph this to the local coordinate system we will need a few helper functions, the key one being shown below.
For the Medium version of the code, I just add them in the script tag one by one before the init() and render() functions are called.
/*** Converts lat lon and radius of sphere to location on spheric surface.* https://en.wikipedia.org/wiki/Spherical_coordinate_system* @param {number} lat latitude* @param {number} lon longitude* @param {number} rad radius* @returns {object} object containing x, y, z fields*/var latLonToSphere = function(lat, lon, rad){ return { x: rad * Math.cos(radians(lat))*Math.cos(radians(lon)), y: rad * Math.cos(radians(lat))*Math.sin(radians(lon)), z: rad * Math.sin(radians(lat)) };};
The prepareLineData() function converts the data from the input format given the helper function above. The internal details are of less importance, but with these helpers available to us, we can create these lines and add them to the scene as seen in the code below. We don’t have any changes to them after first render, so we will just stuff everything in the init function to make the reading of the code as easy as possible.
var convertedLineData = prepareLineData(lineData, globeConfigs.EARTH_RAD, globeConfigs.MULTIPLIER);var lineGroup = new THREE.Group();var materialLine = new THREE.LineBasicMaterial({color: 0x3393B8});// Loop over converted data
// Each key in the object is a latitude
// Each latitude key has an array, each containing array being the data, with lat/lon/alt being in the coordinate frame, for one single 'line'
// The line is constructed and added to a group.for(var lat in convertedLineData){  convertedLineData[lat].forEach((arr) => {    var vectorArr = arr.map(p => new THREE.Vector3( p.x, p.y, p.z ));      if(vectorArr.length <= 1) { return; }      var curve = new THREE.CatmullRomCurve3(vectorArr);      var points = curve.getPoints( vectorArr.length*4 );      var geometry = new THREE.BufferGeometry().setFromPoints( points );      var curveObject = new THREE.Line( geometry, materialLine );      lineGroup.add(curveObject);  });}// Lastly the whole lineGroup is added to the scenescene.add(lineGroup);
After these additions we have the base of the visualization done as seen in the GIF below, and we can finally see the neat effect the lowered opacity has for the overall visual impact.
Second step is to add in a path connecting two locations.
Here we will cut a few corners in that
- It will just be static as everything else, meaning that after initialization we don’t touch it at all.
- We introduce a lot of magic numbers, that will show the API usage, but is… questionable in real projects.
The mapping function latLonToSphere() is used, in addition to a linear interpolation function called lerp() .
The following code is added after the line code in the usual init() function. We simply calculate three positions — starting point, middle point, and end point. These are fed into a quadratic Bezier curve constructor, and inserted into the scene.
It is not strictly required to use a BufferGeometry() as shown below for this curve, but it gives access to geometry.setDrawRange(fromPoint, toPoint) method, which — according to the documentation — is relatively inexpensive to use for animations (set geometry.setDrawRange(0,0) and animate to the end point, or the reverse direction).
var LAT_LONS = {
// Stockholm
ST: {lat: 59.3, lon: 18.0},
// Shanghai
SH: {lat: 31.2, lon: 121.4},
};// Start, middle and end positions of curve
var start = latLonToSphere(LAT_LONS.ST.lat, LAT_LONS.ST.lon, globeConfigs.EARTH_RAD);var middle = latLonToSphere(
lerp(LAT_LONS.ST.lat, LAT_LONS.SH.lat, 0.5),
lerp(LAT_LONS.ST.lon, LAT_LONS.SH.lon, 0.5),
globeConfigs.EARTH_RAD + 0.5
);var end = latLonToSphere(LAT_LONS.SH.lat, LAT_LONS.SH.lon, globeConfigs.EARTH_RAD);var curve = new THREE.QuadraticBezierCurve3(
new THREE.Vector3( start.x, start.y, start.z ),
new THREE.Vector3( middle.x, middle.y, middle.z ),
new THREE.Vector3( end.x, end.y, end.z ),
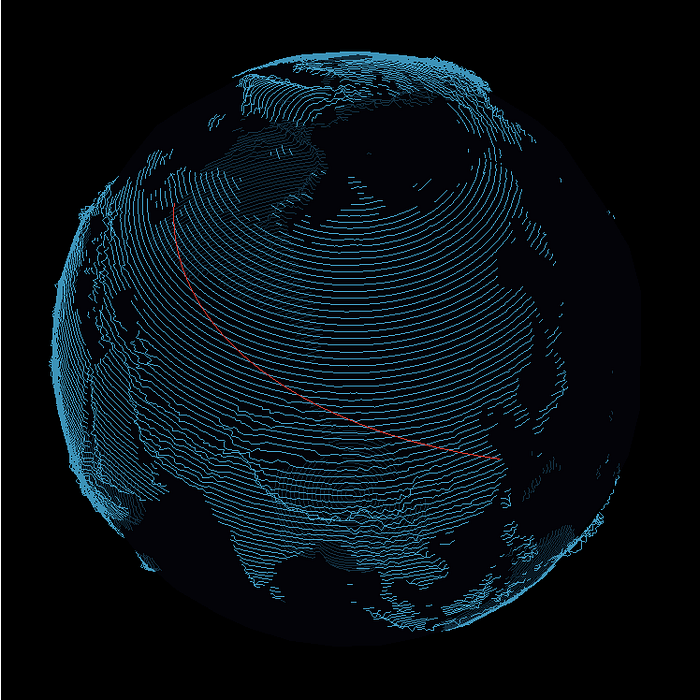
);var points = curve.getPoints(50);var geometry = new THREE.BufferGeometry().setFromPoints( points );var material = new THREE.LineBasicMaterial( { color : 0xff0000 } );var curveObject = new THREE.Line( geometry, material );scene.add(curveObject);
Where are we now?
Okay, so we have reached the end of this with a static, but spinning globe, that looks like this:
Having added everything as the text went on — AND in an as linear fashion as possible — we have ended up with a huge init()function which does all of the work, just using a few helper-functions.
Before extending this in any way, a major refactoring would be almost required. My code structure in the main project is certainly not perfect, and set up for a specific use case, but it is certainly better than this, and can be found in the Github repo.
Disclaimer: This is my first experience with THREE.js so there could be inefficiencies in the way I have used the API, although I tried to look into it as much as possible while coding.